Fig. 5
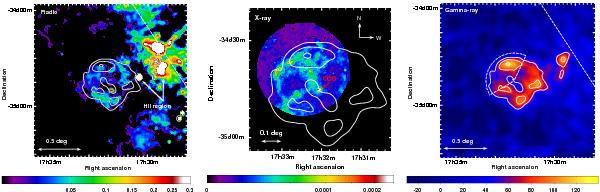
Multi-wavelength view of the HESS J1731−347 region. The radio and the γ-ray image show the same field of view while the X-ray image is zoomed in order to show the details of the shell structure. The significance contours at 4, 6 and 8σ obtained with an integration radius of 0.06° and the Galactic plane (white dashed line) are overlaid in the three panels. Left: ATCA radio map at 1.4 GHz from the south Galactic plane survey (SGPS) in units of Jy/beam with a beam of 100′′. The HII regions G353.42-0.37 (left) and G353.381-0.114 (right) are marked with arrows. Middle: XMM-Newton observation of a sub-region of the SNR, in the 0.5–4.5 keV energy band, using MOS instruments with units in ph/cm2/s/arcmin2. The position of the source XMMU J173203.3−344518, which is likely to be the CCO of the SNR is shown by the red arrow. Right: TeV γ-ray excess map of HESS J1731−347 smoothed with a Gaussian with σ = 0.04°. The region used to derive the radio flux and the spectral parameters in X- and γ-rays for the SED is also shown.
Current usage metrics show cumulative count of Article Views (full-text article views including HTML views, PDF and ePub downloads, according to the available data) and Abstracts Views on Vision4Press platform.
Data correspond to usage on the plateform after 2015. The current usage metrics is available 48-96 hours after online publication and is updated daily on week days.
Initial download of the metrics may take a while.