Fig. 1
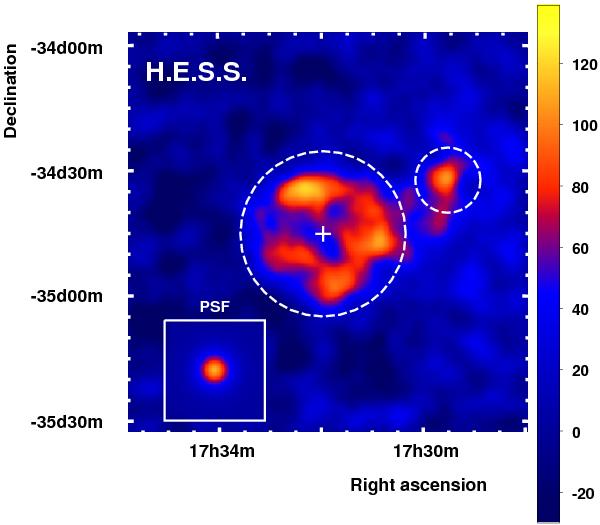
TeV γ-ray excess map (1.5° × 1.5°) of the HESS J1731−347 region smoothed with a Gaussian width σ = 0.04°. The average HESS PSF for the dataset is shown in the inset. The regions used for the spectral analysis of HESS J1731−347 and HESS J1729−345 are respectively represented by the large and small dashed circles. The position of the central compact object detected in X-rays is shown with a white cross. The linear scale is in units of excess counts per smoothing Gaussian width. The transition between blue and red in the color scale is at the level of 4σ.
Current usage metrics show cumulative count of Article Views (full-text article views including HTML views, PDF and ePub downloads, according to the available data) and Abstracts Views on Vision4Press platform.
Data correspond to usage on the plateform after 2015. The current usage metrics is available 48-96 hours after online publication and is updated daily on week days.
Initial download of the metrics may take a while.