Fig. 4
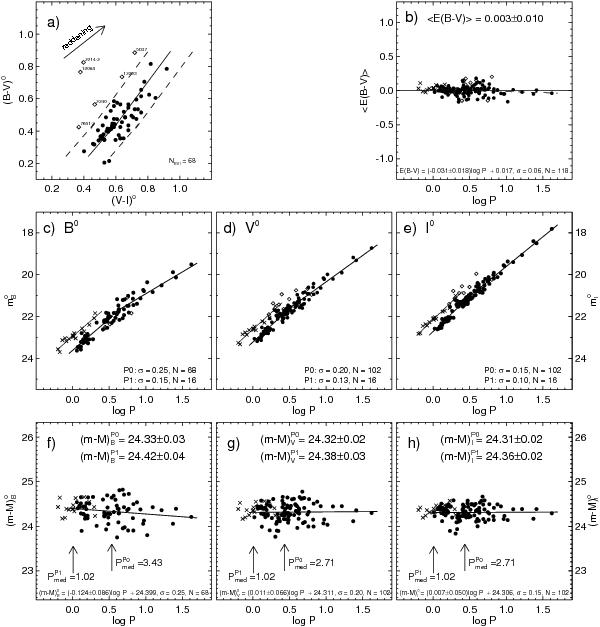
a) The two-color index diagram (B − V)0 versus (V − I)0 of the P0 Cepheids of IC 1613. The region of SMC Cepheids is outlined. Cepheids outside this region are identified and shown as open diamonds. They are repeated in the following panels, but not used for the fits. b) The individual internal color excesses E(B − V) and E(V − I), combined here into mean values of ⟨ E(B − V) ⟩ , as a function of log P. c)–e) The cleaned P-L relations in B, V, and I of the P0 Cepheids (dots) and P1 (crosses) Cepheids. The full and thin lines are the SMC P-L relations for P0 and P1 pulsators, respectively, fitted to the data. f)–h) The individual true distance moduli of the Cepheids of IC 1613 as a function of log P. The full lines are fits to only the P0 Cepheids; their equations are indicated at the bottom of the panels. The mean distances, read at the median period Pmed, are shown for P0 and P1 Cepheids for each color.
Current usage metrics show cumulative count of Article Views (full-text article views including HTML views, PDF and ePub downloads, according to the available data) and Abstracts Views on Vision4Press platform.
Data correspond to usage on the plateform after 2015. The current usage metrics is available 48-96 hours after online publication and is updated daily on week days.
Initial download of the metrics may take a while.