Fig. 8
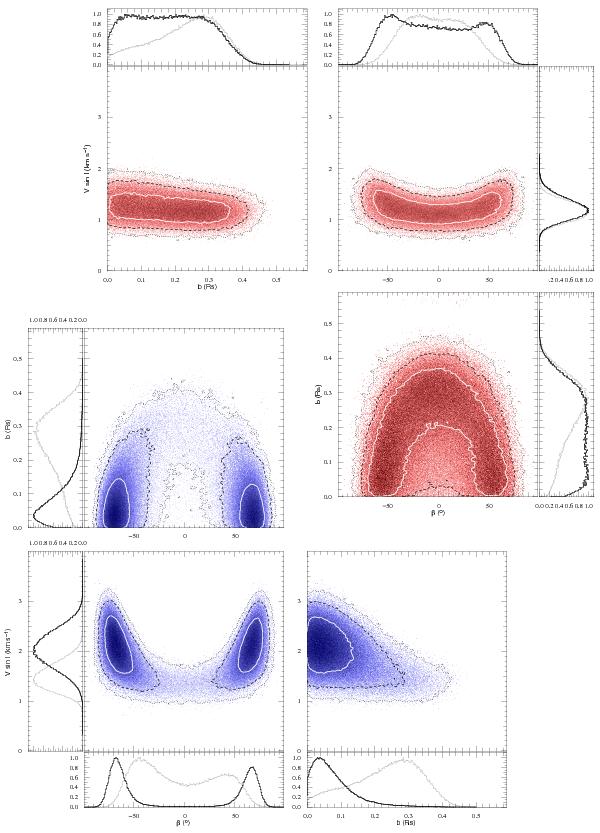
Square boxes present the a posteriori probability density functions for V sin I, β and impact parameter b, from which we extract our results. The white contour marks the 68.27% confidence region. The black dashed contour shows the 95.45%, and the black dotted contour the 99.73% confidence regions. Marginalised distributions are also shown as black histograms in side boxes, normalised to the mode. At the top right, in red, we have the results for a circular, non drifting solution with use of a prior of v = 1.35 ± 0.20 km s-1. On bottom left, in blue, we show a circular, non-drifting solution with the application of a prior of v sin I = 2.2 ± 0.3 km s-1. Grey histograms in V sin I and β show results in the photometry limited runs; for b, we plotted the resulting distribution by fitting the photometry alone without the Rossiter-McLaughlin effect.
Current usage metrics show cumulative count of Article Views (full-text article views including HTML views, PDF and ePub downloads, according to the available data) and Abstracts Views on Vision4Press platform.
Data correspond to usage on the plateform after 2015. The current usage metrics is available 48-96 hours after online publication and is updated daily on week days.
Initial download of the metrics may take a while.