Fig. 5
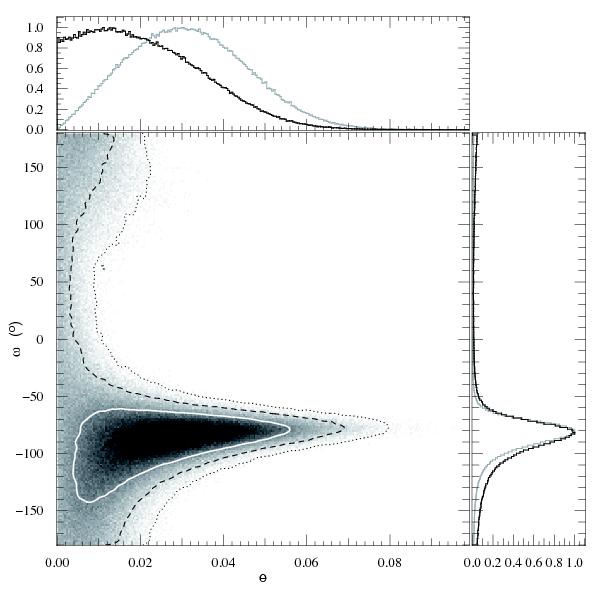
In the central box we show the a posteriori probability density function for e and ω, resulting from a chain using  and
and  as free parameters (from which e and ω were computed to fit an eccentric model to the data). The white contour marks the 68.27% confidence region. The black dashed contour shows the 95.45%, and the black dotted contour is the 99.73% confidence region. Marginalised distributions are also shown as black histograms in side boxes, which have been normalised to the mode. Grey histograms in the side boxes show the same fit but instead having e cos ω and e sin ω as jump parameters.
Current usage metrics show cumulative count of Article Views (full-text article views including HTML views, PDF and ePub downloads, according to the available data) and Abstracts Views on Vision4Press platform.
Data correspond to usage on the plateform after 2015. The current usage metrics is available 48-96 hours after online publication and is updated daily on week days.
Initial download of the metrics may take a while.