Fig. 2
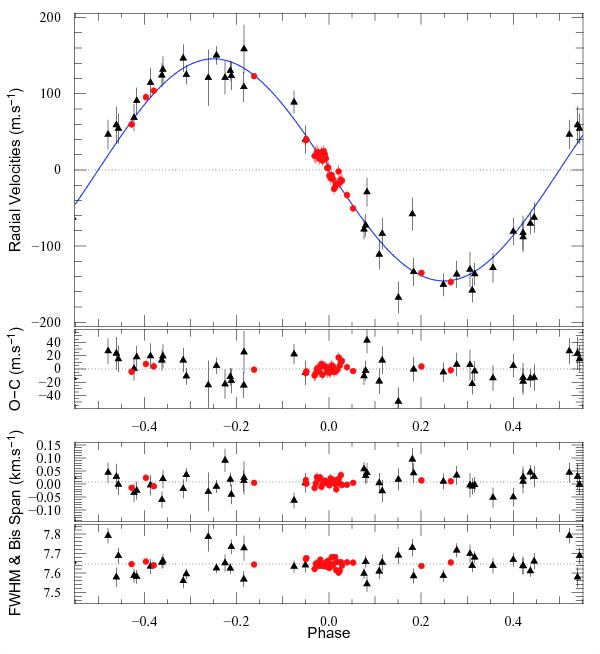
Black triangles: CORALIE data; red discs: HARPS data. Top: radial velocities with model superimposed, and residuals (both in m s-1), as a function of orbital phase. Added are the 1σ error bars. Bottom: phased bisector span and FWHM (both in km s-1). The HARPS data has been translated to have its mean correspond to the CORALIE data.
Current usage metrics show cumulative count of Article Views (full-text article views including HTML views, PDF and ePub downloads, according to the available data) and Abstracts Views on Vision4Press platform.
Data correspond to usage on the plateform after 2015. The current usage metrics is available 48-96 hours after online publication and is updated daily on week days.
Initial download of the metrics may take a while.