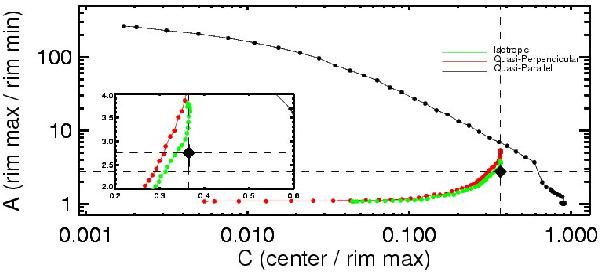
Fig. 3

Comparison between synthesized radio maps for a uniform B at an age of 1000 yr (black, green, and red dots for quasi-parallel, quasi-perpendicular, and isotropic injection efficiency, respectively) and the observed radio map (black diamond, the inset shows a zoom of the plot around this point) by means of the use of the A and C morphological parameters introduced in Fig. 2. Each curve represents the values spanned by the parameters when the aspect angle φB goes from 0° (rightmost part) to 90° (leftmost part).
Current usage metrics show cumulative count of Article Views (full-text article views including HTML views, PDF and ePub downloads, according to the available data) and Abstracts Views on Vision4Press platform.
Data correspond to usage on the plateform after 2015. The current usage metrics is available 48-96 hours after online publication and is updated daily on week days.
Initial download of the metrics may take a while.


