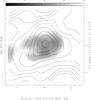
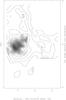
Fig. 4
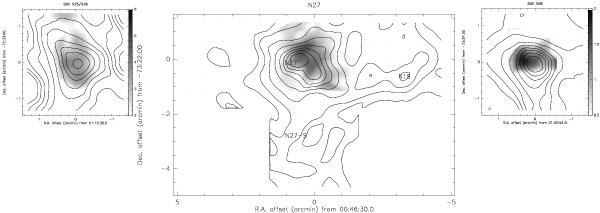
Left: [C II] Map of SMC-N 25 field. Contours are linear at multiples of 0.72 × 10⁻⁵ erg cm-2 s-1 sr-1. Integrated J = 1−0 12CO emission is represented by grayscales in the range 0.5−5.0 K km s-1. Center: [C II] Map of SMC-N 27 field. Contours are linear at multiples of 1.35 × 10⁻⁵ erg cm-2 s-1 sr-1. The positions of the H II regions N27, N27-S, and N 19 are indicated. Integrated J = 1−0 12CO emission is represented by grayscales in the range 1.0−13.0 K km s-1. Right: [C II] map of SMC-N 88 field. Contours are linear at multiples of 0.72 × 10⁻⁵ erg cm-2 s-1 sr-1. Integrated J = 1−0 12CO emission is represented by grayscales in the range 0.2−2.4 K km s-1.

Current usage metrics show cumulative count of Article Views (full-text article views including HTML views, PDF and ePub downloads, according to the available data) and Abstracts Views on Vision4Press platform.
Data correspond to usage on the plateform after 2015. The current usage metrics is available 48-96 hours after online publication and is updated daily on week days.
Initial download of the metrics may take a while.