Fig. 1
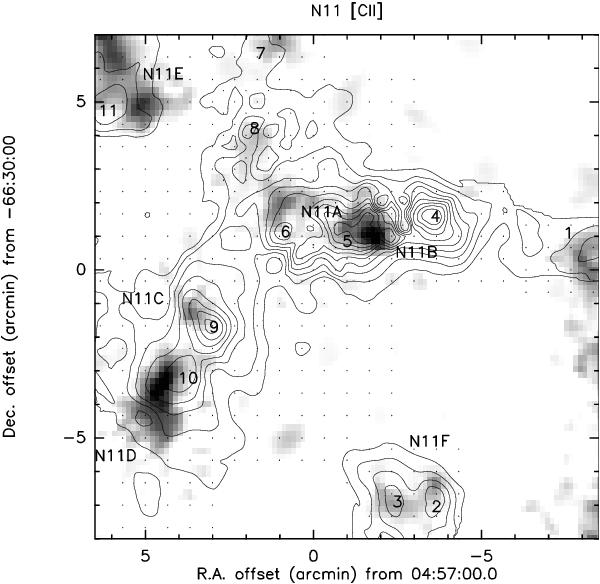
Map of the central part of LMC-N 11. [C II] contours are linear at multiples of 2.125 × 10⁻⁵ erg cm-2 s-1 sr-1. Integrated J = 1−0 12CO emission is represented by grayscales in the range 1−10 K km s-1. Small dots mark the grid points sampled in [C II]. The locations of the major H II region components N 11A through N 11F are schematically indicated. All [C II] peaks (marked by their number from Tables 2 and 3) are associated with a CO cloud. The lack of CO emission near [C II] cloud 4 may reflect poor sampling of the CO map at this position.
Current usage metrics show cumulative count of Article Views (full-text article views including HTML views, PDF and ePub downloads, according to the available data) and Abstracts Views on Vision4Press platform.
Data correspond to usage on the plateform after 2015. The current usage metrics is available 48-96 hours after online publication and is updated daily on week days.
Initial download of the metrics may take a while.