Fig. 4
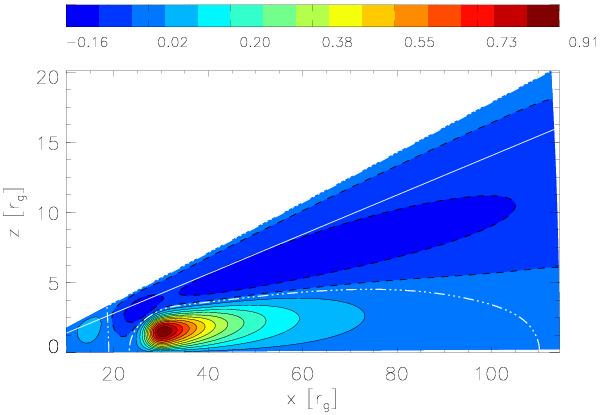
Contour plot of the toroidal field in Cartesian coordinates, in the region r = [10−115] rg and θ = 80°−90°. The black solid lines are lines of positive Bφ, while black dashed lines are used for negative Bφ. Bφ = 0 is shown with triple dotted-dashed white lines. The straight white line indicates the boundary between disc and corona.
Current usage metrics show cumulative count of Article Views (full-text article views including HTML views, PDF and ePub downloads, according to the available data) and Abstracts Views on Vision4Press platform.
Data correspond to usage on the plateform after 2015. The current usage metrics is available 48-96 hours after online publication and is updated daily on week days.
Initial download of the metrics may take a while.