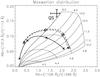
Fig. 9
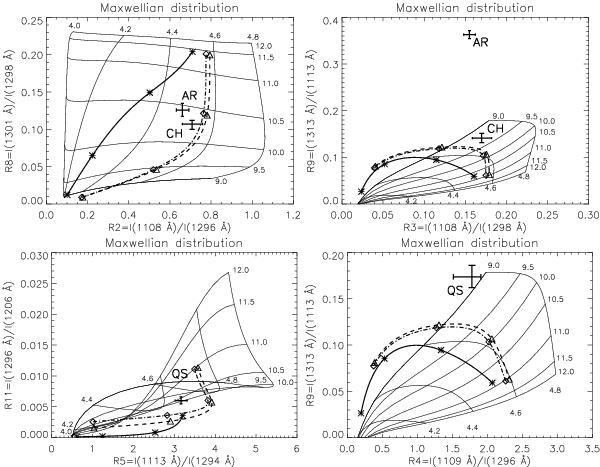
Relation between ratios R2 and R8 (above, left), R3–R9 (above, right), R5–R11 (below, left) and R4–R9 (below, right) for the Maxwellian distribution (thick black lines) computed for the solar atmosphere with a constant pressure characterized by Ne × T = 1013–1016 cm-3 K with the DEM 3 (full lines), DEM 2 (dot-dashed lines), and DEM 1 (dashed lines). The points correspond to DEMs with Ne × T = 1013, 1014, 1015, and 1016 cm-3 K. The crosses with error bars show observed line ratios.
Current usage metrics show cumulative count of Article Views (full-text article views including HTML views, PDF and ePub downloads, according to the available data) and Abstracts Views on Vision4Press platform.
Data correspond to usage on the plateform after 2015. The current usage metrics is available 48-96 hours after online publication and is updated daily on week days.
Initial download of the metrics may take a while.