Free Access
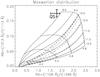
Fig. 5
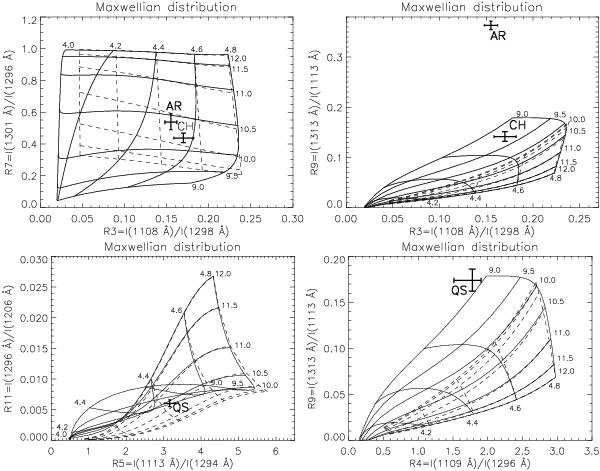
Schematic T–Ne diagnostic diagrams for Maxwellian distribution with (full lines) and without (dashed lines) included radiation field for AR and CH (top) and for QS (bottom). The crosses show the observed values for AR, QS, and CH with their errors by Pinfield et al. (1999).
This figure is made of several images, please see below:
Current usage metrics show cumulative count of Article Views (full-text article views including HTML views, PDF and ePub downloads, according to the available data) and Abstracts Views on Vision4Press platform.
Data correspond to usage on the plateform after 2015. The current usage metrics is available 48-96 hours after online publication and is updated daily on week days.
Initial download of the metrics may take a while.