Fig. 10
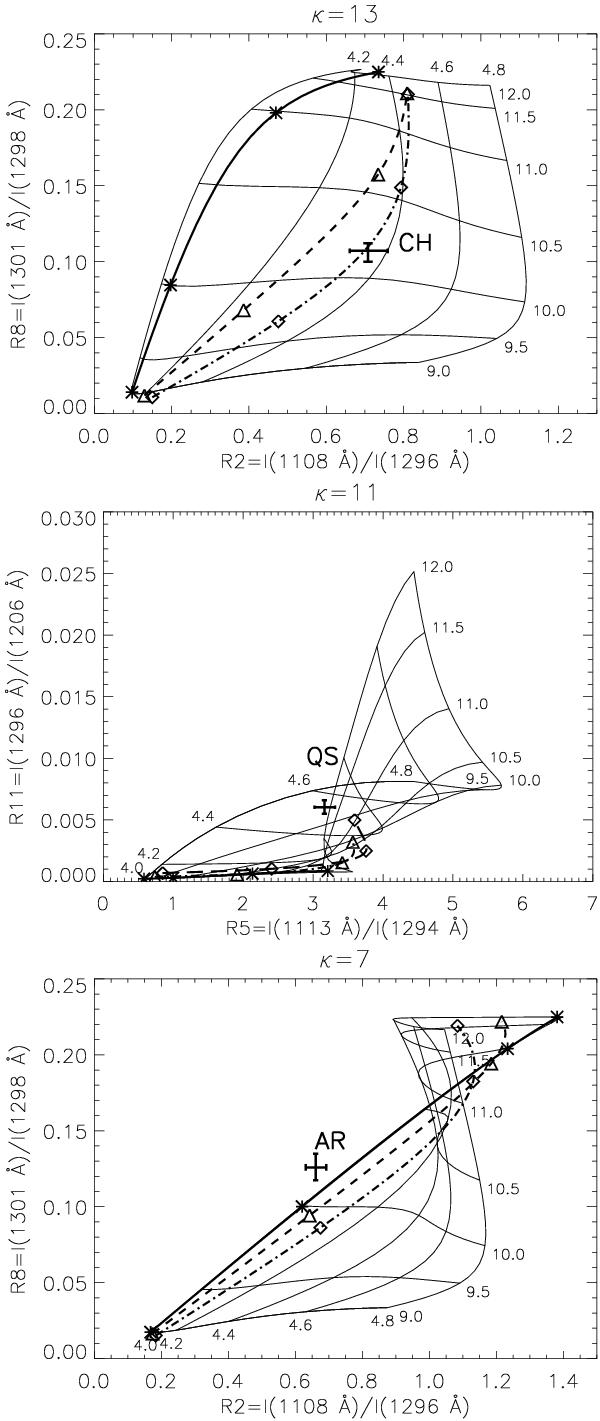
Comparison of the calculated R2–R8 for different DEMs (DEM 1: dashed line, DEM 2: dot-dashed line, DEM 3: full line) and κ = 13 with the diagnostics figure for κ = 13 (top), calculated R5–R11 for different DEMs and κ = 11 with the diagnostics figure for κ = 11 (middle), and calculated R2–R8 for different DEMs and κ = 7 with the diagnostics figure for κ = 7 (bottom). The black crosses with the error bars mark observed line ratios in CH, QS, and AR.
Current usage metrics show cumulative count of Article Views (full-text article views including HTML views, PDF and ePub downloads, according to the available data) and Abstracts Views on Vision4Press platform.
Data correspond to usage on the plateform after 2015. The current usage metrics is available 48-96 hours after online publication and is updated daily on week days.
Initial download of the metrics may take a while.