Fig. 6
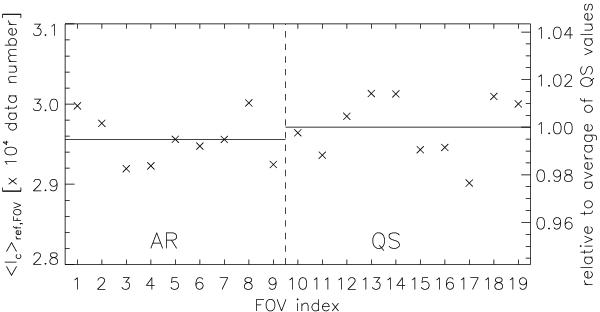
Values of the contrast references ⟨Ic⟩ref,FOV used in the different AR and QS FOVs, in original data units. The FOV index labels the FOVs according to the order of Table 2. The horizontal bars represent the average values of the ⟨Ic⟩ref,FOV in the AR (left) and QS (right) FOVs. The right-hand side y axis gives the values relative to the QS average.
Current usage metrics show cumulative count of Article Views (full-text article views including HTML views, PDF and ePub downloads, according to the available data) and Abstracts Views on Vision4Press platform.
Data correspond to usage on the plateform after 2015. The current usage metrics is available 48-96 hours after online publication and is updated daily on week days.
Initial download of the metrics may take a while.