Fig. 1
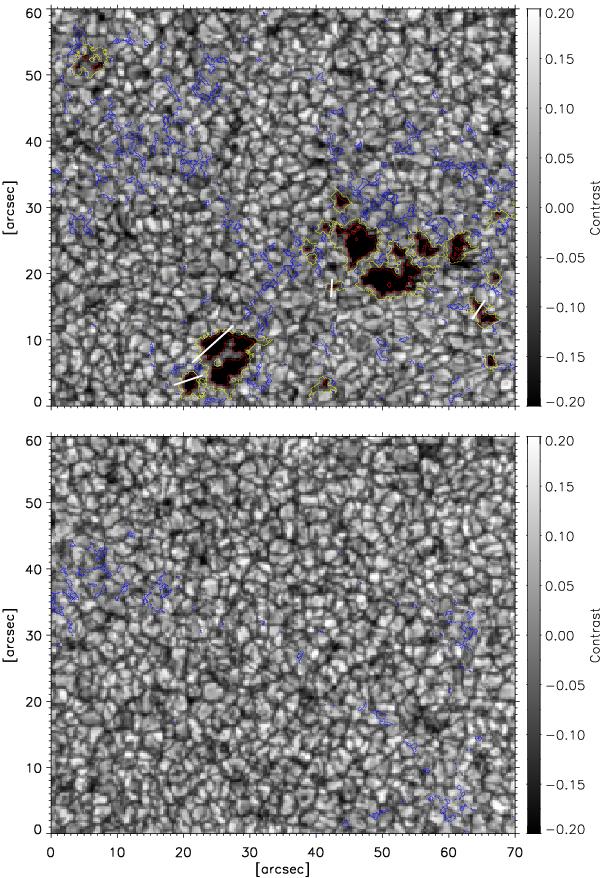
Upper panel: continuum contrast of an active region plage field of view at disk center (μ > 0.99), extracted from the SP scan of day 01-02-2007 (see Table 1). Bottom panel: same for a field of view including quiet Sun network, extracted from the SP scan of day 24-04-2007. Blue contours: locations of the pixels where Bapp,los lies in an interval of ±200 G around the peak value of the contrast vs. Bapp,los relation (see Fig. 2). The red contours surround the “core” of the pores where the contrast is below −0.15 and Bapp,los > 900 G, while the yellow contours outline the entire pore areas removed from the analysis. The white lines across some pores coincide with the locations of the cuts discussed in Sect. 3.5.
Current usage metrics show cumulative count of Article Views (full-text article views including HTML views, PDF and ePub downloads, according to the available data) and Abstracts Views on Vision4Press platform.
Data correspond to usage on the plateform after 2015. The current usage metrics is available 48-96 hours after online publication and is updated daily on week days.
Initial download of the metrics may take a while.