Fig. 8
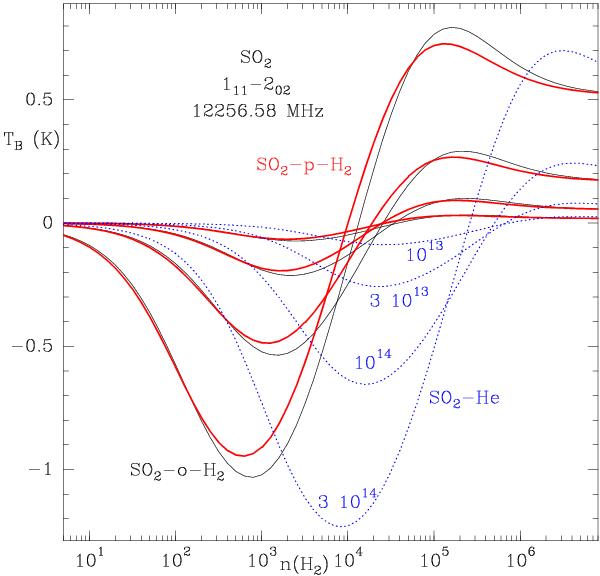
Predicted brightness temperature for the 111 − 202 line of SO2 at 12.256 GHz for different sets of collisional rates. The assumed kinetic temperature and Δv= are 10 K and 1 km s-1, respectively. Black(thin)/red(thick) lines correspond to the excitation of the molecule by o-H2/p-H2 using the collisional rates calculated in this work. Blue(dashed) lines correspond to the predicted intensity when the scaled He-rates of Green (1995) are used. Column densities are indicated and correspond to 3 × 10¹⁴, 1014, 3 × 10¹³, and 1013 cm-2.
Current usage metrics show cumulative count of Article Views (full-text article views including HTML views, PDF and ePub downloads, according to the available data) and Abstracts Views on Vision4Press platform.
Data correspond to usage on the plateform after 2015. The current usage metrics is available 48-96 hours after online publication and is updated daily on week days.
Initial download of the metrics may take a while.