Fig. 13
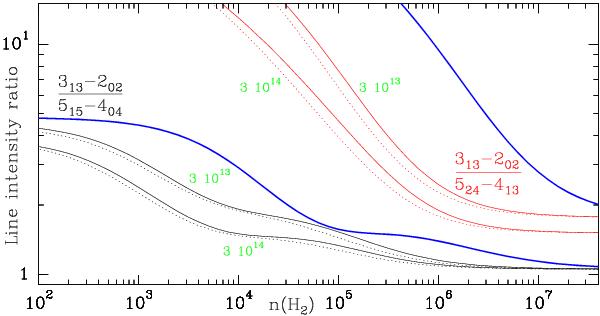
Predicted line intensity ratios for selected lines of interest for the study of dark clouds. The assumed kinetic temperature and Δv= are 10 K and 1 km s-1, respectively. Solid/dashed lines correspond to the case of collisional excitation by ortho/para H2. The results correspond to N(SO2) = 3 × 10¹³ and 3 × 1014 cm-2. The blue thick curve corresponds to N(SO2) = 3 × 1014 cm-2 but using the collisional rates SO2/He of Green (1995).
Current usage metrics show cumulative count of Article Views (full-text article views including HTML views, PDF and ePub downloads, according to the available data) and Abstracts Views on Vision4Press platform.
Data correspond to usage on the plateform after 2015. The current usage metrics is available 48-96 hours after online publication and is updated daily on week days.
Initial download of the metrics may take a while.