Fig. 2
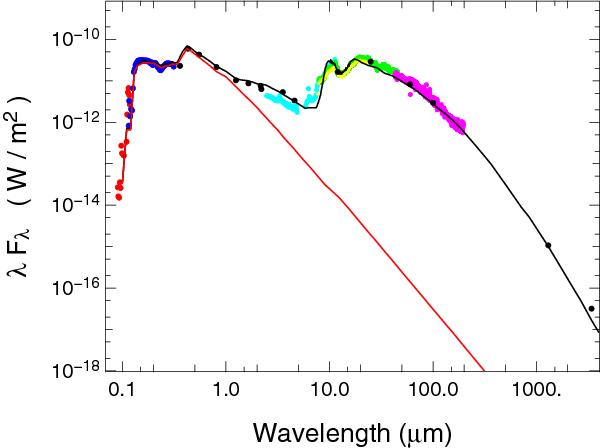
Observed spectral energy distribution of HD 100546 compared to our best-model prediction (full black line, Teff = 10 500 K, 26 L⊙, Av = 0.2, Rv = 5.5). The photosphere is shown as a red line. The photometric data used in B10 are represented by black dots. The binned FUSE spectrum is plotted with red dots, the binned IUE spectrum with blue dots, the archival ISO data are plotted with cyan dots for ISO-PHOT, green dots for ISO-SWS, and magenta dots for ISO-LWS. The IRAS-LRS data are represented by yellow dots.
Current usage metrics show cumulative count of Article Views (full-text article views including HTML views, PDF and ePub downloads, according to the available data) and Abstracts Views on Vision4Press platform.
Data correspond to usage on the plateform after 2015. The current usage metrics is available 48-96 hours after online publication and is updated daily on week days.
Initial download of the metrics may take a while.