Free Access
Fig. 4
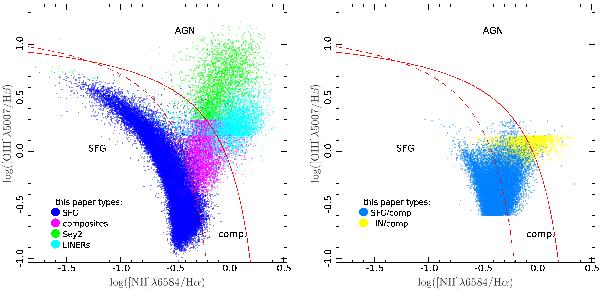
Results of the new diagnostic derived in the present paper in the standard log([Oiii] λ5007/Hβ) vs. log([Nii] λ6583/Hα) diagram. For clarity, only SFGs, AGNs and composites are shown in the left panel, while SFG/comp and LIN/comp are shown in the right panel. Same color code as in Fig. 1.
This figure is made of several images, please see below:
Current usage metrics show cumulative count of Article Views (full-text article views including HTML views, PDF and ePub downloads, according to the available data) and Abstracts Views on Vision4Press platform.
Data correspond to usage on the plateform after 2015. The current usage metrics is available 48-96 hours after online publication and is updated daily on week days.
Initial download of the metrics may take a while.