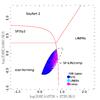
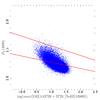
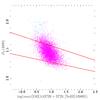
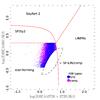
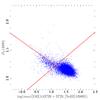
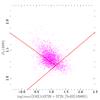
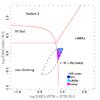
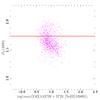
Fig. 3
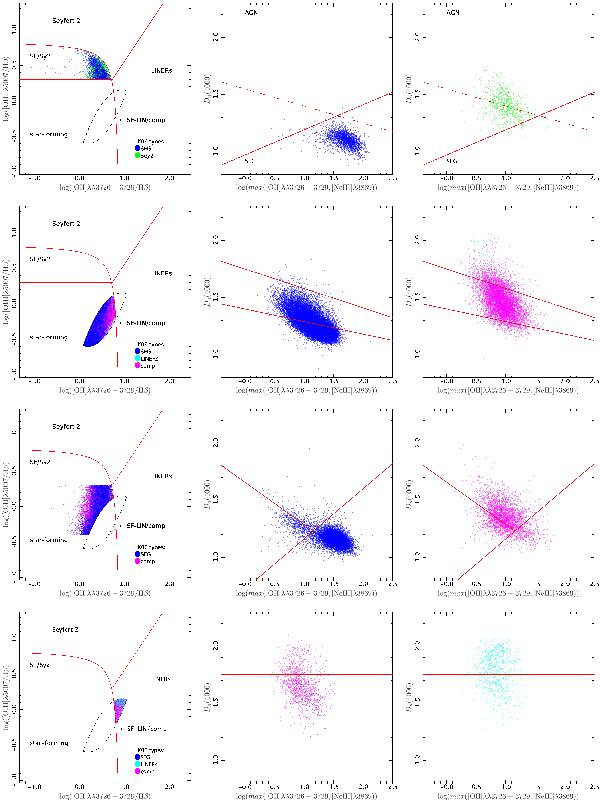
Left: in the log ([Oiii] λ5007/Hβ) vs. log ([Oii] λλ3726 + 3729/Hβ) diagram, the different regions where galaxies of different types are mixed (color-code according to the reference K06 diagnostic). The curves are the ones from the Lamareille (2010) diagnostic. Center and right: the same points as in the associated left panels, but now in the Dn(4000) vs.  diagram. For clarity, we plot the different types in two panels. The solid lines show the adopted demarcation lines (see text for details). The dashed line in top-right panels is the separation adopted by Stasińska et al. (2006).
Current usage metrics show cumulative count of Article Views (full-text article views including HTML views, PDF and ePub downloads, according to the available data) and Abstracts Views on Vision4Press platform.
Data correspond to usage on the plateform after 2015. The current usage metrics is available 48-96 hours after online publication and is updated daily on week days.
Initial download of the metrics may take a while.