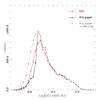
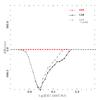
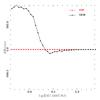
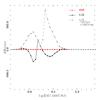
Fig. 2
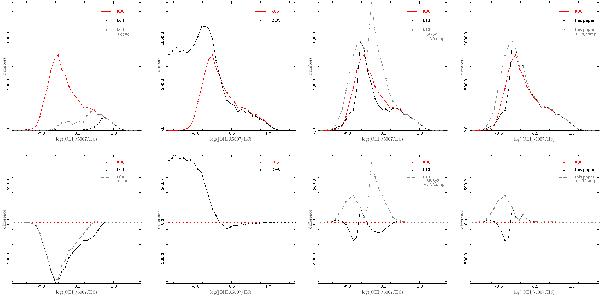
Comparison between the number of AGNs (Seyfert 2 and LINERs) counted with different calibrations at high redshift, as a function of log([Oiii] λ5007/Hβ). From left to right, the calibrations used are L04, DEW, L10 (Paper I), and the present paper. Top panels show absolute counts. Bottom panels show difference counts. In each panel, the reference counts established with the K06 diagnostic are shown in red, and the counts obtained with the high-redshift diagnostic are shown in black. The gray dashed lines show the results when including “candidate” regions, i.e. for L04, L10, and the present paper’s classifications: candidate AGNs region; SFG/Sy2 and LIN/comp regions; LIN/comp region.
Current usage metrics show cumulative count of Article Views (full-text article views including HTML views, PDF and ePub downloads, according to the available data) and Abstracts Views on Vision4Press platform.
Data correspond to usage on the plateform after 2015. The current usage metrics is available 48-96 hours after online publication and is updated daily on week days.
Initial download of the metrics may take a while.