Fig. 1
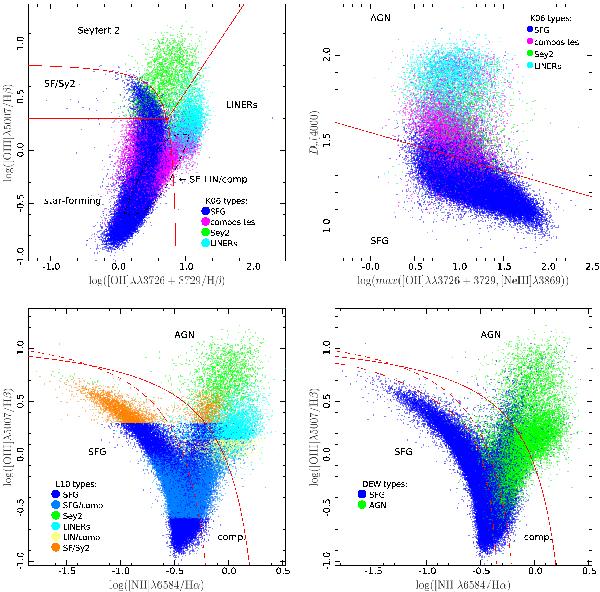
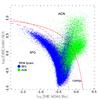
Summary of existing schemes for the classification of emission-line galaxies at high redshift. Top: results of the reference diagnostic (Kewley et al. 2006) are shown in the log([Oiii] λ5007/Hβ) vs. the log ([Oii] λλ3726 + 3729/Hβ) diagram (left) and in the Dn(4000) vs.  diagram (right). The code is blue: SFG; green: Seyfert 2; cyan: LINERs; magenta: composites. Bottom: the results of the high-redshift classifications are shown in the standard log([Oiii] λ5007/Hβ) vs. log([Nii] λ6583/Hα) diagram. Left: the L10 diagnostic (Lamareille 2010). Right: the DEW diagnostic (Stasińska et al. 2006). Same color code as above except green: stands for all AGNs in the bottom-right panel; light blue: SFG/comp; yellow: LIN/comp; orange: SF/Sy2. In bottom-right panel, the long dashed line is the boundary between SFG and AGN used by Stasińska et al. (2006).
Current usage metrics show cumulative count of Article Views (full-text article views including HTML views, PDF and ePub downloads, according to the available data) and Abstracts Views on Vision4Press platform.
Data correspond to usage on the plateform after 2015. The current usage metrics is available 48-96 hours after online publication and is updated daily on week days.
Initial download of the metrics may take a while.