Fig. 1
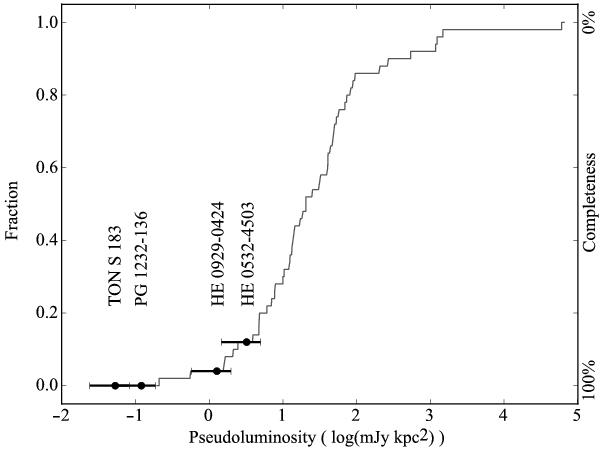
Cumulative histogram of pseudo luminosities for the known MSP population in the ATNF database. The left axis is labelled with the cumulative fraction of MSPs; the right axis is labelled with survey completeness for each candidate. The errors on the pseudo luminosity upper limits contain errors on the distance, pulse duty cycle and our estimate of the relevant range of (S/Nmin) values used with the pulsar radiometer equation (see Sect. 4).
Current usage metrics show cumulative count of Article Views (full-text article views including HTML views, PDF and ePub downloads, according to the available data) and Abstracts Views on Vision4Press platform.
Data correspond to usage on the plateform after 2015. The current usage metrics is available 48-96 hours after online publication and is updated daily on week days.
Initial download of the metrics may take a while.