Free Access
Fig. 7
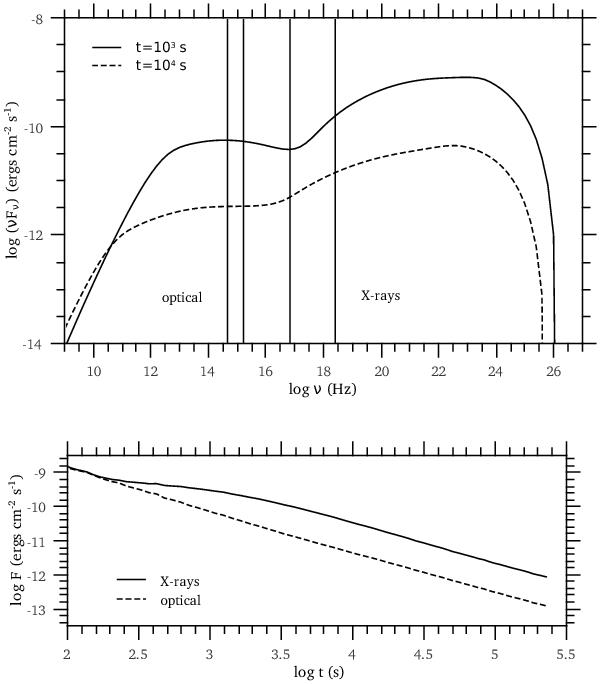
Multiwavelength spectra at observer times 103 s and 104 s (top) and light curves for the X-ray and optical band (bottom) for an SSC dominated afterglow. For the parameters used, see text. The X-ray and optical windows are as given in Fig. 2.
Current usage metrics show cumulative count of Article Views (full-text article views including HTML views, PDF and ePub downloads, according to the available data) and Abstracts Views on Vision4Press platform.
Data correspond to usage on the plateform after 2015. The current usage metrics is available 48-96 hours after online publication and is updated daily on week days.
Initial download of the metrics may take a while.