Fig. 6
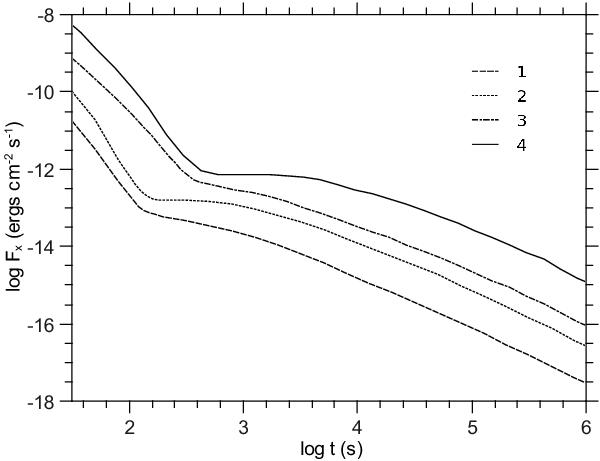
X-ray light curves for different set of parameters corresponding to the points from 1 to 4 (bottom to top) marked in Fig. 5. The first break of the X-ray light curves 1 and 2 occurs at around 125 s, while for the light curves 3 and 4 occurs later at t ~ 650 s. For clarity reasons, light curves 1, 3, and 4 are plotted with an offset of −0.2, +0.4 and +0.5 in logarithmic units of flux.
Current usage metrics show cumulative count of Article Views (full-text article views including HTML views, PDF and ePub downloads, according to the available data) and Abstracts Views on Vision4Press platform.
Data correspond to usage on the plateform after 2015. The current usage metrics is available 48-96 hours after online publication and is updated daily on week days.
Initial download of the metrics may take a while.