Fig. 5
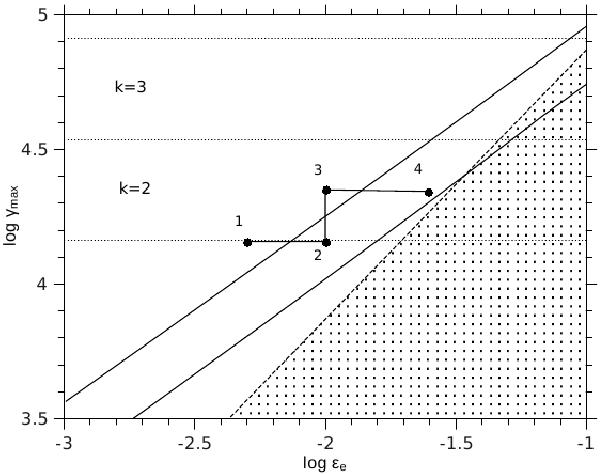
Initial value parameter space of γmax and ϵe for E0 = 1054 erg, Γ0 = 400,n0 = 1 part/cm3,ϵB = 0.001 and p = 2.3. The numerical factors chosen here are A = 8,b = 0.001 (see text for their definition). Dotted lines correspond to the constraining relation (9), solid lines to (23) and the dashed line sets the boundary of the striped area, which is not permitted because it it leads to γmax = γmin,0. The horizontal zones labeled by k = 2 and k = 3 correspond to transition times  lying in the time intervals 102–103 s and 103–104 s, respectively. The “coordinates” (ϵe,γmax) of the points 1 to 4 marked on the plot are { (0.005,1.41 × 104), (0.01,1.41 × 104), (0.01,2.24 × 104), (0.025,2.24 × 104) } , respectively . The corresponding X-ray and optical light curves of the points are presented below in Figs. 6 and 8.
Current usage metrics show cumulative count of Article Views (full-text article views including HTML views, PDF and ePub downloads, according to the available data) and Abstracts Views on Vision4Press platform.
Data correspond to usage on the plateform after 2015. The current usage metrics is available 48-96 hours after online publication and is updated daily on week days.
Initial download of the metrics may take a while.