Free Access
Fig. 3
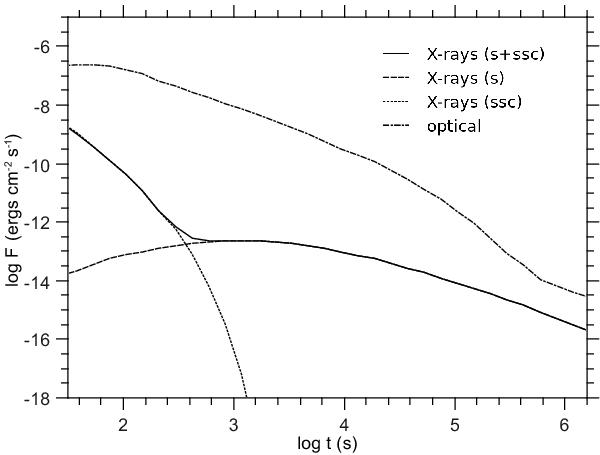
X-ray (solid line) and optical (dashed-dotted line) light curve corresponding to the same case as in Fig. 2. The contribution of the synchrotron (dotted line) and SSC (dashed line) components to the total X-ray flux are also shown. The optical light curve is shifted by +2.5 units in logarithm for reasons of better display.
Current usage metrics show cumulative count of Article Views (full-text article views including HTML views, PDF and ePub downloads, according to the available data) and Abstracts Views on Vision4Press platform.
Data correspond to usage on the plateform after 2015. The current usage metrics is available 48-96 hours after online publication and is updated daily on week days.
Initial download of the metrics may take a while.