Fig. 12
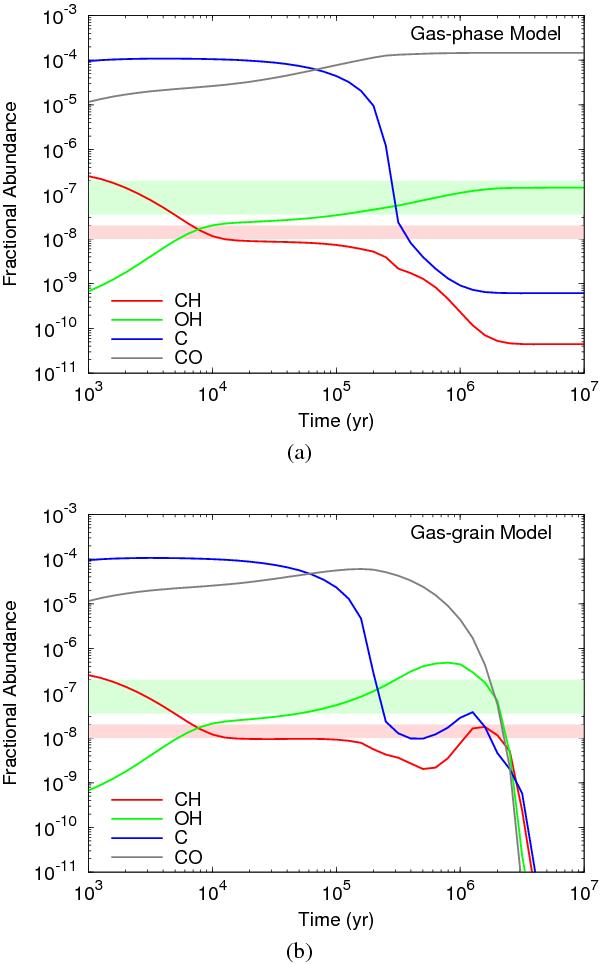
Plots showing the fractional abundances (with respect to H2 number density) of CH and OH as functions of time, calculated using a gas-phase chemistry only model a) and a gas-grain model b) for a TMC-1-like cloud (see Sect. 4.1). Also shown in this figure are the fractional C and CO abundances. The shaded regions represent the observed range of CH and OH fractional abundances derived by us along the TMC-1 ridge.
Current usage metrics show cumulative count of Article Views (full-text article views including HTML views, PDF and ePub downloads, according to the available data) and Abstracts Views on Vision4Press platform.
Data correspond to usage on the plateform after 2015. The current usage metrics is available 48-96 hours after online publication and is updated daily on week days.
Initial download of the metrics may take a while.