Fig. 1
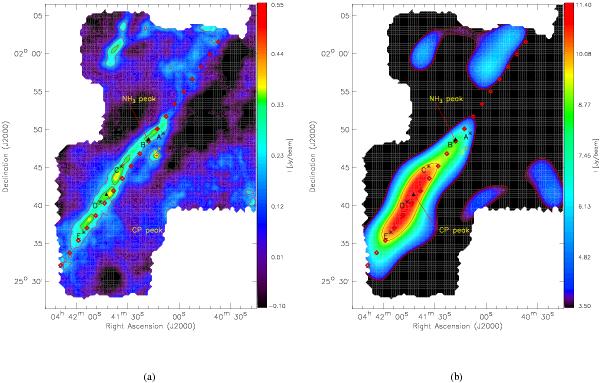
TMC-1 as seen by SCUBA at 850 μm (convolved to 30″ in a) and 228″ in b)). The map is reproduced from Nutter et al. (2008), who calls the filament “the Bull’s Tail”. The red diamonds represent the locations of our CH spectral observations (separated by 2′), and the black triangles mark the locations of the cyanopolyyne and ammonia maxima. The letters A–E and X mark the regions of the six dense cores as per Hirahara et al. (1992), with the asterisks marking the locations of the CCS maxima corresponding to the six cores. The two contour line levels correspond to intensities of 0.19 and 0.32 Jy/beam on the 30″ resolution map and 3.5 and 9.6 Jy/beam on the 228″ map. The filled red diamond on the image is located at  , δJ2000 = 25°50′04″, marking the origin of the CH observations performed by us.
Current usage metrics show cumulative count of Article Views (full-text article views including HTML views, PDF and ePub downloads, according to the available data) and Abstracts Views on Vision4Press platform.
Data correspond to usage on the plateform after 2015. The current usage metrics is available 48-96 hours after online publication and is updated daily on week days.
Initial download of the metrics may take a while.