Fig. 1
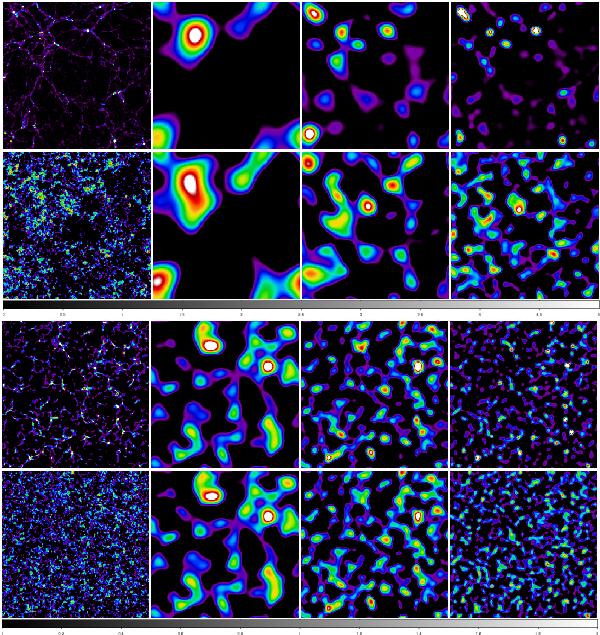
High-resolution density fields and their wavelet decompositions for models M100 and M768, upper two and lower two rows, respectively. Model M100 fields are given at k = 1 coordinate, M768 fields at k = 217 coordinate. Left panels show the density fields, next panels their wavelet decompositions. For both models upper panels show the field and wavelets at redshift z = 0, and lower panels at redshift z = 100. For model M100 we show the wavelets w6, w5, and w4, for model M768 wavelets w5, w4, and w3. In plotting density fields and wavelets we use only over-dense regions: i.e., lower density limit (which corresponds to black level in DS9 colour palette SLS) is taken equal to 1 for the density field, and 0 for wavelets. Upper density levels (which correspond to white in palette SLS) are given in Table 1. Table 1 gives also the upper smoothing wavelength Swnd in h-1 Mpc for all wavelets.
Current usage metrics show cumulative count of Article Views (full-text article views including HTML views, PDF and ePub downloads, according to the available data) and Abstracts Views on Vision4Press platform.
Data correspond to usage on the plateform after 2015. The current usage metrics is available 48-96 hours after online publication and is updated daily on week days.
Initial download of the metrics may take a while.