Free Access
Fig. 3
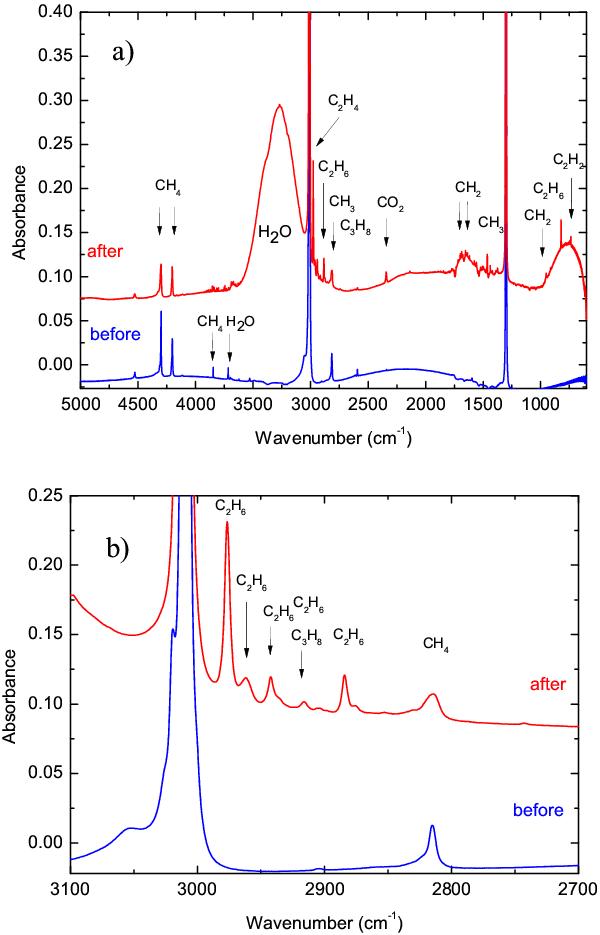
Comparison of FTIR spectra regions of the CH4 ice at 15 K before (lower) and after (upper) irradiation. The spectrum corresponds to a final fluence of 4.29 × 10¹³ ions/cm2. a) Range of 600 − 5000 cm-1 and b) range of 2700 − 3100 cm-1.
This figure is made of several images, please see below:
Current usage metrics show cumulative count of Article Views (full-text article views including HTML views, PDF and ePub downloads, according to the available data) and Abstracts Views on Vision4Press platform.
Data correspond to usage on the plateform after 2015. The current usage metrics is available 48-96 hours after online publication and is updated daily on week days.
Initial download of the metrics may take a while.