Fig. 1
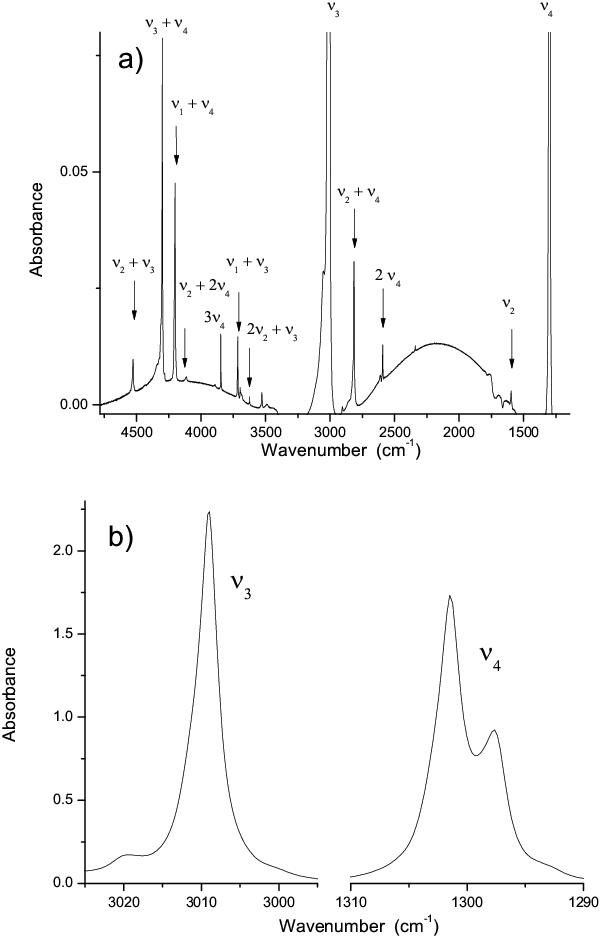
Infrared spectrum of the methane ice at 15 K, before irradiation. In a) the absorbance scale has been enlarged to make the less intense combination bands of all CH4 assignments visible and b) zoom of the ν3 (this band is slightly saturated, but it does not significantly change the band profile) and ν4 assignments. The vibration modes at 1302 and 1298 cm-1 are considered as centered at 1300 cm-1.
Current usage metrics show cumulative count of Article Views (full-text article views including HTML views, PDF and ePub downloads, according to the available data) and Abstracts Views on Vision4Press platform.
Data correspond to usage on the plateform after 2015. The current usage metrics is available 48-96 hours after online publication and is updated daily on week days.
Initial download of the metrics may take a while.