Fig. 8
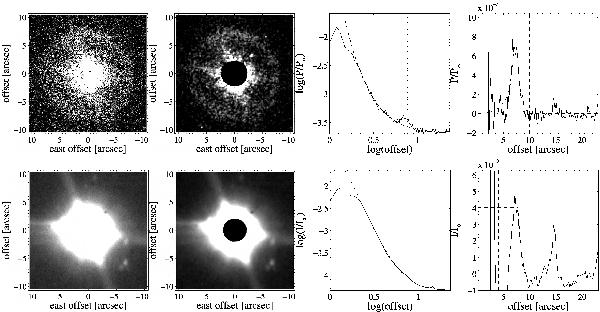
The detached shell around DR Ser. North is up and east is left. The upper row shows the polarized intensity images. The lower row shows the total-intensity images. Upper row, far left: the polarized intensity P. Upper row, middle left: the polarized intensity in the shell Psh. Upper row, middle right: the AARP of the polarized intensity normalized to the stellar intensity (same as in Fig. 4). The dashed line shows the PSF-fit. The vertical dashed lines indicate regions not included in the fit, i.e., the inner part close to the mask and the region where the shell is located. The vertical dotted line shows the determined radius of the shell (see text for details). Upper row, far right: the AARP of the subtracted image. The lower row shows the same images but for the total unpolarized intensity I (far left and middle right), and the total unpolarized intensity in the shell Ish (middle left and far right). The peak at 15″ in the lower right plot is due to a background star.
Current usage metrics show cumulative count of Article Views (full-text article views including HTML views, PDF and ePub downloads, according to the available data) and Abstracts Views on Vision4Press platform.
Data correspond to usage on the plateform after 2015. The current usage metrics is available 48-96 hours after online publication and is updated daily on week days.
Initial download of the metrics may take a while.