Fig. 6
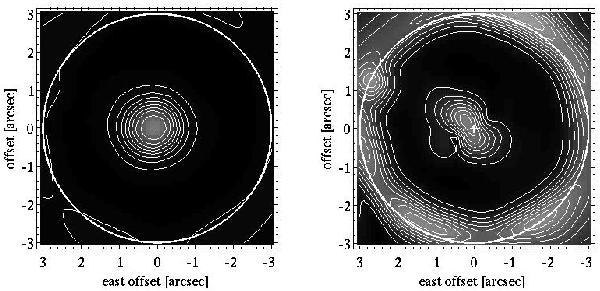
Left: contour map of the R-band total intensity as seen through the 6″ mask. The contours are drawn in log-scale at 10%-steps relative to the maximum intensity. The outermost contour of the central structure corresponds to an 80% decrease in the intensity. Right: contour map of the R-band polarized intensity as seen through the 6″ mask. The contours are drawn at 10%-steps relative to the maximum intensity. The outermost contour of the central structure corresponds to a 70% decrease in the intensity. In both images, the cross marks the location of the star and the thick line marks the edge of the mask. North is up and east is left.
Current usage metrics show cumulative count of Article Views (full-text article views including HTML views, PDF and ePub downloads, according to the available data) and Abstracts Views on Vision4Press platform.
Data correspond to usage on the plateform after 2015. The current usage metrics is available 48-96 hours after online publication and is updated daily on week days.
Initial download of the metrics may take a while.