Fig. 4
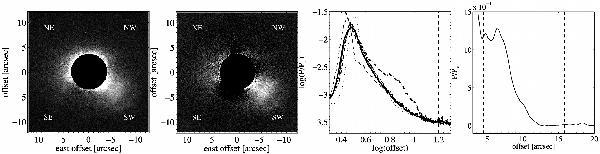
The R-band polarized-intensity image of the circumstellar envelope around W Aql. North is up and east is left. Far left: the polarized intensity, P, of the inner 10″. Middle left: the polarized-intensity image after the fit to the three weaker-emission quadrants (SE, NE, NW, see text for further explanation) has been subtracted. Middle right: the log-log AARPs of the polarized intensity over the different quadrants. The y-axis is normalized to the polarized intensity “of the star”, P∗, i.e., the polarized intensity within the 3σ area of a Gaussian fitted to the star (see Sect. 5.2 for details on how the size of the star was estimated). The vertical dashed lines indicate the most reliable region of the image, and this is also the area used for the fit. The areas close to the coronographic disk, and close to the edge of the image, are excluded since they are less reliable. The thin dotted line shows the AARP over the NW quadrant. The thin dashed line shows the AARP over the SE quadrant. The thin solid line shows the AARP over the NE quadrant. These three quadrants look very similar in the reliable region and the thick solid line shows the average of all three. The thick dash-dotted line shows the SW quadrant, which is clearly brighter in this area of the image. The thick dashed line shows the polynomial fit to the average over the three weaker-emission quadrants. Far right: the AARP over the SW quadrant after the polynomial fit to the three weaker-emission quadrants has been subtracted.
Current usage metrics show cumulative count of Article Views (full-text article views including HTML views, PDF and ePub downloads, according to the available data) and Abstracts Views on Vision4Press platform.
Data correspond to usage on the plateform after 2015. The current usage metrics is available 48-96 hours after online publication and is updated daily on week days.
Initial download of the metrics may take a while.