Fig. 16
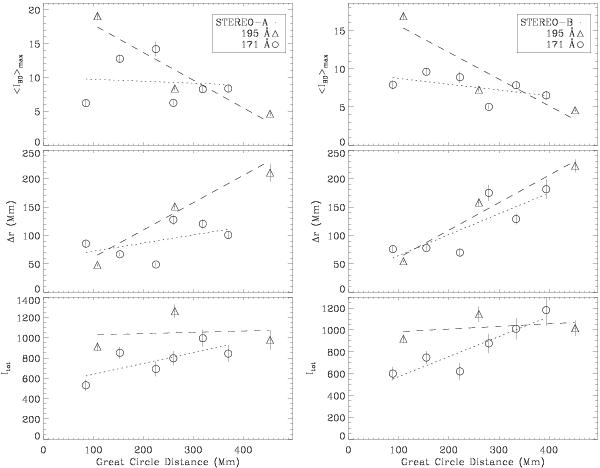
Top: variation in peak percentage base difference intensity (⟨ IBD ⟩ max) with distance. Middle: variation in FWHM of the Gaussian pulse with distance. Bottom: variation in integrated intensity (Itot) with distance. Left-hand plots correspond to STEREO-A data, with STEREO-B data on the right-hand side. The dashed (dotted) line in all panels indicates the best linear fit to the 195 Å (171 Å) data. More cases are displayed in Figs. 17 to 18.
Current usage metrics show cumulative count of Article Views (full-text article views including HTML views, PDF and ePub downloads, according to the available data) and Abstracts Views on Vision4Press platform.
Data correspond to usage on the plateform after 2015. The current usage metrics is available 48-96 hours after online publication and is updated daily on week days.
Initial download of the metrics may take a while.