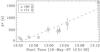
Fig. 12
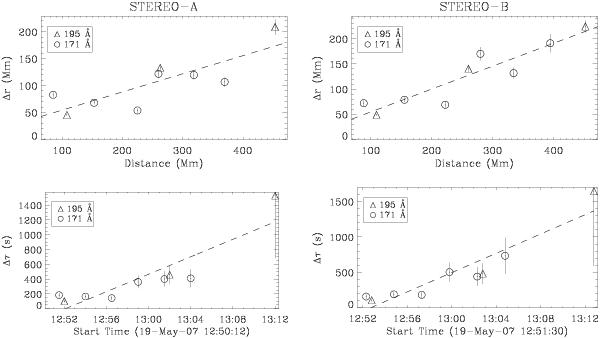
Top: variation in pulse spatial width (Δr) with distance for the 2007 May 19 event. Bottom: variation in pulse temporal width (Δτ) with time. Panels contain data from STEREO-A (left) and STEREO-B (right). Pulse spatial width here refers to the FWHM of the fitted Gaussian pulse (i.e.,  ). The dashed line in all panels indicates the best linear fit to the data. More cases are displayed in Figs. 13 to 15.
Current usage metrics show cumulative count of Article Views (full-text article views including HTML views, PDF and ePub downloads, according to the available data) and Abstracts Views on Vision4Press platform.
Data correspond to usage on the plateform after 2015. The current usage metrics is available 48-96 hours after online publication and is updated daily on week days.
Initial download of the metrics may take a while.