Fig. 9
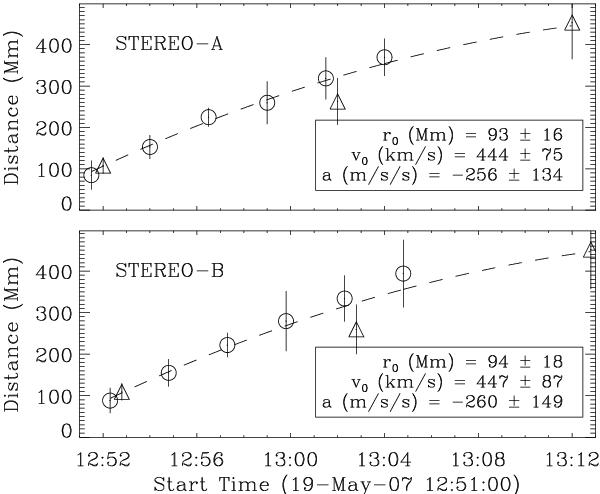
Distance-time plots for STEREO-A (top) and STEREO-B (bottom). The 171 Å (circles) and 195 Å (triangles) data have been combined as they follow similar kinematical curves. The mean offset distance, initial velocity, and acceleration terms resulting from the bootstrapping analysis (fit indicated by dashed line) are also stated in the bottom right of each panel, with errors represented by the standard deviation. The errors on each point are given by the error on the mean of the Gaussian fit applied to the intensity profile. More cases are displayed in Figs. 10 and 11.
Current usage metrics show cumulative count of Article Views (full-text article views including HTML views, PDF and ePub downloads, according to the available data) and Abstracts Views on Vision4Press platform.
Data correspond to usage on the plateform after 2015. The current usage metrics is available 48-96 hours after online publication and is updated daily on week days.
Initial download of the metrics may take a while.