Fig. 8
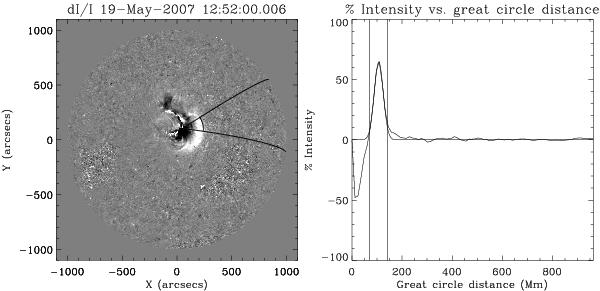
Left panel: PBD image with arc sector over-plotted. Right panel: intensity profile across arc sector. The intensity profile at a given distance corresponds to the mean intensity across the arc sector at that distance. This is then fitted using a Gaussian model and repeated for the next image. The vertical lines in the right-hand plot and arc lines in the left-hand plot correspond to the 2σ limits of the Gaussian fit. The associated movie (15879_mov.mpeg) shows the procedure used to build these diagrams.
Current usage metrics show cumulative count of Article Views (full-text article views including HTML views, PDF and ePub downloads, according to the available data) and Abstracts Views on Vision4Press platform.
Data correspond to usage on the plateform after 2015. The current usage metrics is available 48-96 hours after online publication and is updated daily on week days.
Initial download of the metrics may take a while.