Fig. 1
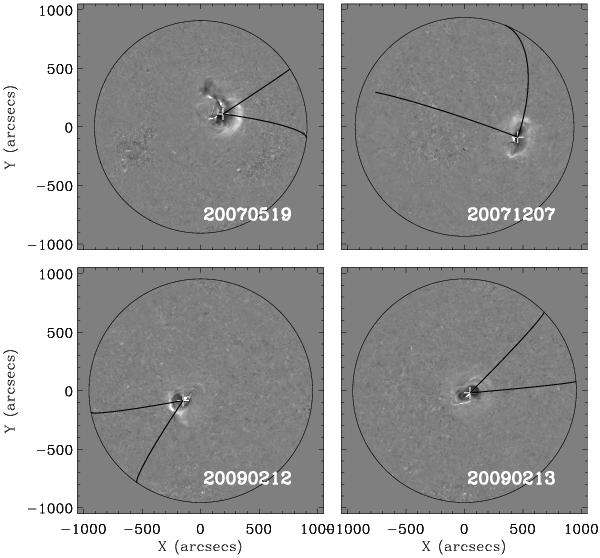
Percentage base difference images of the 2007 May 19 (top left), 2007 Dec. 07 (top right), 2009 Feb. 12 (bottom left) and 2009 Feb. 13 (bottom right) CBFs, each in the 195 Å passband as seen by STEREO-B. The solid lines indicate the region in which the disturbance was identified using the intensity profile technique, while the cross marks the estimated origin of the event. White (black) is an increase (decrease) in intensity from the base image.
Current usage metrics show cumulative count of Article Views (full-text article views including HTML views, PDF and ePub downloads, according to the available data) and Abstracts Views on Vision4Press platform.
Data correspond to usage on the plateform after 2015. The current usage metrics is available 48-96 hours after online publication and is updated daily on week days.
Initial download of the metrics may take a while.