Fig. A.2
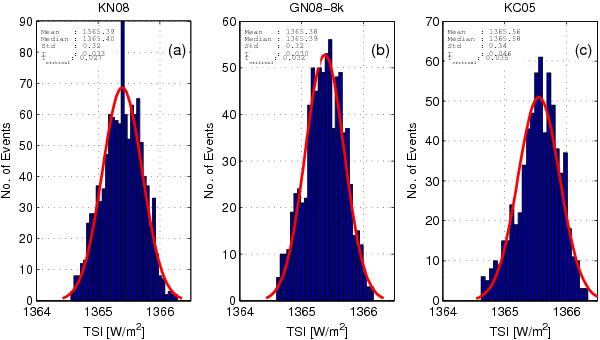
Comparison between the statistical properties of the TSI reconstructions during the Holocene. The time coverage of each time series is presented in Table 3. Panels a) to d) present the distributions of the TSI reconstructions. The red line represents the normal distribution computed employing the sample mean and standard deviation values of as the overplotted sample (the values are indicated in each panel). Additionally, the test statistic (T) and the critical (Tcritical) values are listed.
Current usage metrics show cumulative count of Article Views (full-text article views including HTML views, PDF and ePub downloads, according to the available data) and Abstracts Views on Vision4Press platform.
Data correspond to usage on the plateform after 2015. The current usage metrics is available 48-96 hours after online publication and is updated daily on week days.
Initial download of the metrics may take a while.