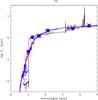
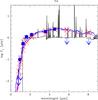
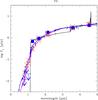
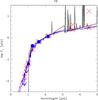
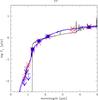
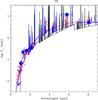
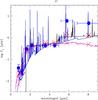
Fig. 6
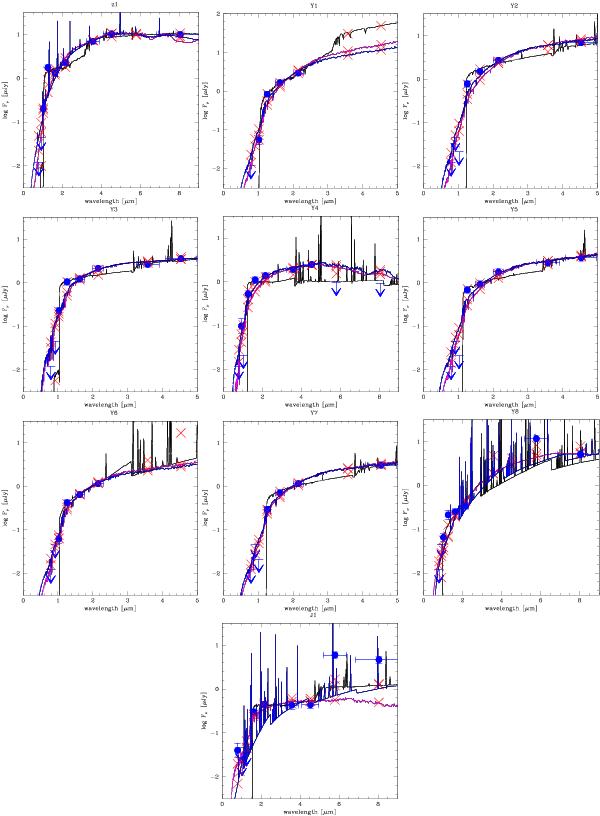
Best-fit SED solutions for high-z (black lines) et low-z (blue and magenta lines) for all the bright z, Y, and J-dropouts found in A2667. Error bars and upper limits correspond to 1σ values, as reported in Table 3. Red crosses indicate the synthetic flux in the filters. High-z (black) spectra include nebular emission. Low-z solutions are displayed for the complete library (including nebular emission) in blue, and for the standard templates in magenta. Note the extended wavelength scale for objects with available 5.8 and 8.0 μm photometry.
Current usage metrics show cumulative count of Article Views (full-text article views including HTML views, PDF and ePub downloads, according to the available data) and Abstracts Views on Vision4Press platform.
Data correspond to usage on the plateform after 2015. The current usage metrics is available 48-96 hours after online publication and is updated daily on week days.
Initial download of the metrics may take a while.