Fig. 1
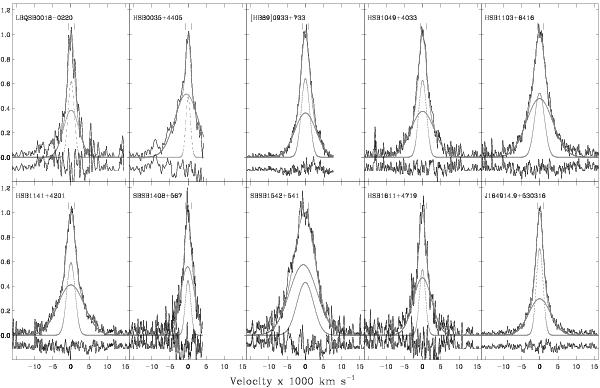
Near-IR spectra of the sample QSOs centered on the Hα emission line, along with our double-Gaussian fits to the line profile. The two Gaussians represent an intermediate-width component (corresponding to the ILR), and a very broad component (corresponding to the VBLR; see text). For each QSO the upper panel shows the normalized QSO spectrum (black) along with the double-Gaussian fit (grey); the lower panel shows the residual spectrum after subtraction of the double-Gaussian fit. The zero velocity is based on the central wavelength of the intermediate-width component of the double-Gaussian fit (see Table 2). The ticks below each QSO name indicate the expected locations of the [N ii] doublet.
Current usage metrics show cumulative count of Article Views (full-text article views including HTML views, PDF and ePub downloads, according to the available data) and Abstracts Views on Vision4Press platform.
Data correspond to usage on the plateform after 2015. The current usage metrics is available 48-96 hours after online publication and is updated daily on week days.
Initial download of the metrics may take a while.