Free Access
Fig. 16
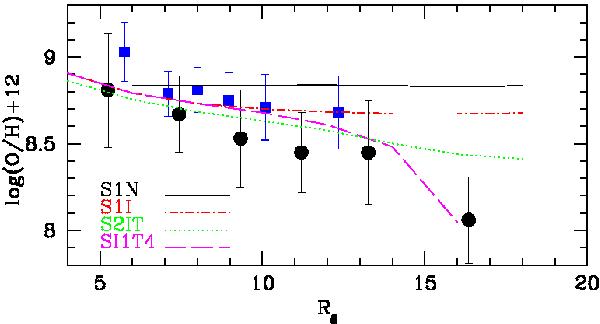
Radial abundance gradient for oxygen for the models S1N (black solid line), S1I (red dotted-dashed line), and S2IT (green dotted line), and SI1T4 (magenta long-dashed line). The data collection from Cepheids (blue squares ) and from HII regions (black circles) are reported.
Current usage metrics show cumulative count of Article Views (full-text article views including HTML views, PDF and ePub downloads, according to the available data) and Abstracts Views on Vision4Press platform.
Data correspond to usage on the plateform after 2015. The current usage metrics is available 48-96 hours after online publication and is updated daily on week days.
Initial download of the metrics may take a while.