Fig. 11
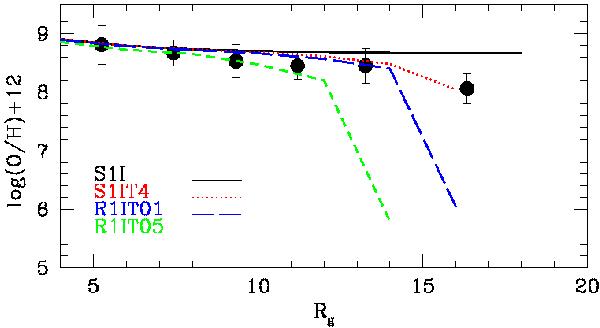
Radial abundance gradient for oxygen. The black solid line refers to the one-infall model without threshold and with inside-out formation (S1I). The red short-dashed line represents the model with a threshold of 4 M⊙ pc-2 (S1IT4), the blue long-dashed line the model with a threshold of 4 M⊙ pc-2 combined with a radial inflow of 0.1 km s-1 (R1T01), and the green dotted line the model with a threshold of 4 M⊙ pc-2 combined inflow of 0.5 km s-1 (R1T05). The data are the same as in Fig. 2.
Current usage metrics show cumulative count of Article Views (full-text article views including HTML views, PDF and ePub downloads, according to the available data) and Abstracts Views on Vision4Press platform.
Data correspond to usage on the plateform after 2015. The current usage metrics is available 48-96 hours after online publication and is updated daily on week days.
Initial download of the metrics may take a while.