Fig. 1
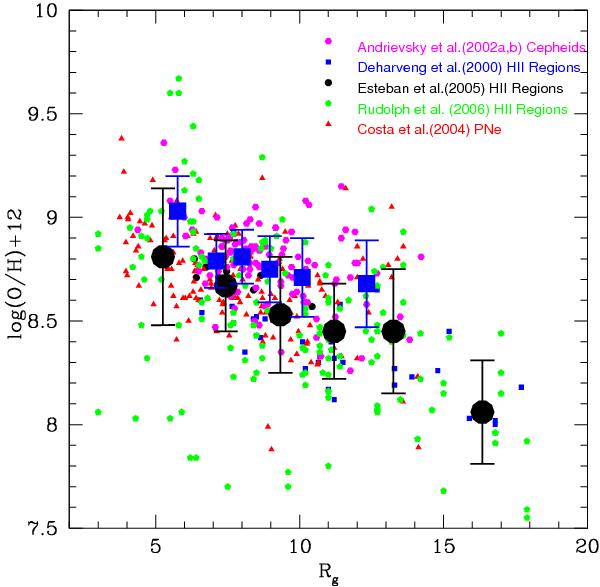
Radial abundance gradient for oxygen from observations. The data are taken by Deharveng et al. (2000) (filled blue squares), Rudolph et al. (2006) (filled green pentagon), Costa et al. (2004) (red filled triangles), Andrievsky et al. (2002a,b) (magenta filled hexagons), and Esteban et al. (2005) (black filled circles). We label with the large blue squared points the mean Cepheids values and relative error bars, whereas with the large black filled circles the mean values form the HII and planetary nebulae regions.
Current usage metrics show cumulative count of Article Views (full-text article views including HTML views, PDF and ePub downloads, according to the available data) and Abstracts Views on Vision4Press platform.
Data correspond to usage on the plateform after 2015. The current usage metrics is available 48-96 hours after online publication and is updated daily on week days.
Initial download of the metrics may take a while.