Fig. 3
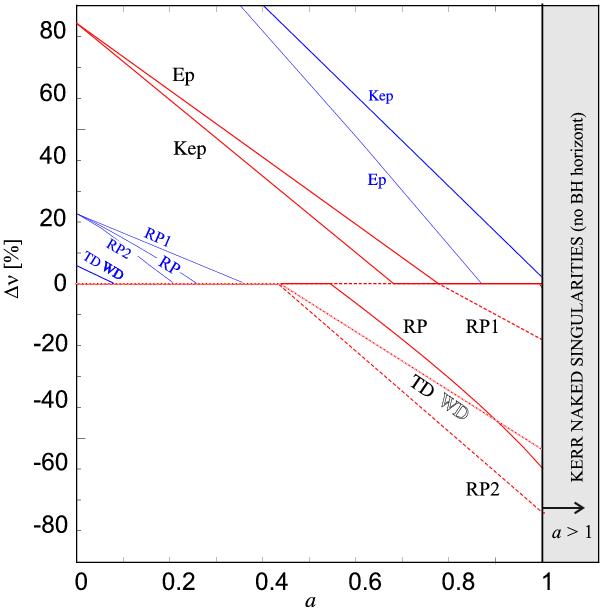
Non-geodesic corrections required for a given model, spin and source. The red curves indicate the minimal corrections required in the case of GRS 1915+105. Parts of these curves with a negative sign also roughly indicate the corrections required for the other two microquasars. The blue curves indicate positive corrections for these microquasars determined by the lower limit to their M × νU indicated by the blue dotted horizontal line in Fig. 2.
Current usage metrics show cumulative count of Article Views (full-text article views including HTML views, PDF and ePub downloads, according to the available data) and Abstracts Views on Vision4Press platform.
Data correspond to usage on the plateform after 2015. The current usage metrics is available 48-96 hours after online publication and is updated daily on week days.
Initial download of the metrics may take a while.