Fig. 2
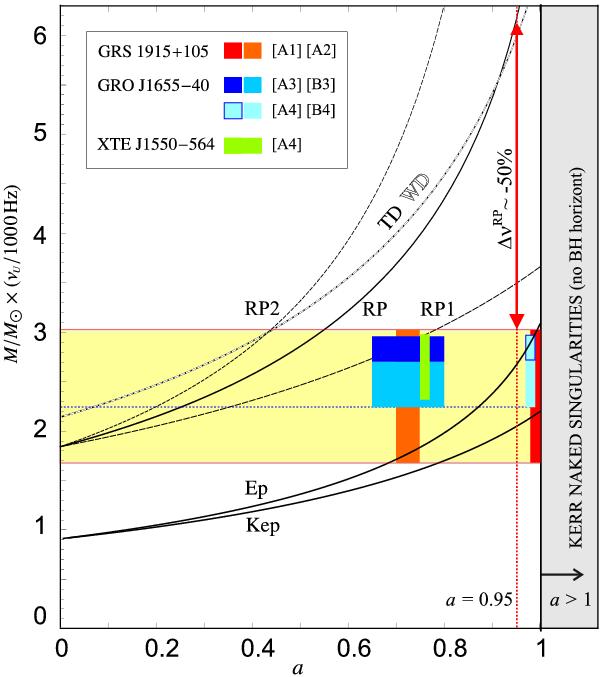
Curves νU × M(a) implied by the individual geodesic models. The light yellow rectangle indicates the observationaly determined interval of νU × M for GRS 1915+105. The red dotted vertical line denotes a = 0.95. The red vertical arrow indicates the correction needed to match the upper limit to νU × M with the RP model for this spin. The colour boxes are drawn for the mass and spectral spin estimates given by different authors for GRS 1915+105, GRO J1655-40 and XTE 1550-564 (see the main text for references). The dotted blue line indicates the lower observational limit to M × νU that is roughly common to GRO J1655-405 and XTE 1550-564.
Current usage metrics show cumulative count of Article Views (full-text article views including HTML views, PDF and ePub downloads, according to the available data) and Abstracts Views on Vision4Press platform.
Data correspond to usage on the plateform after 2015. The current usage metrics is available 48-96 hours after online publication and is updated daily on week days.
Initial download of the metrics may take a while.