Fig. 4
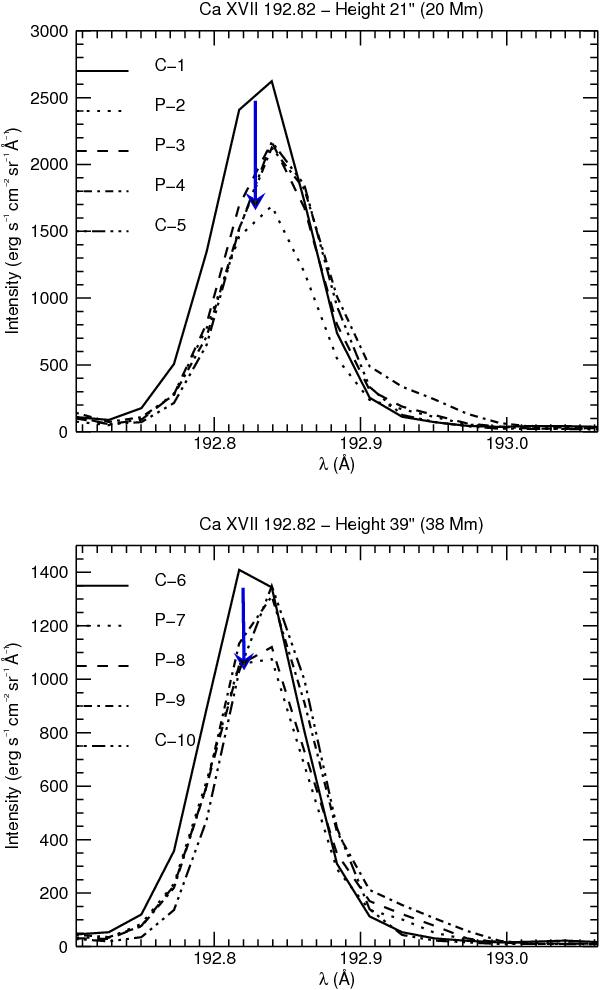
Ca xvii 192 line profiles obtained with fil_rast_s2 on April 26, 2007 between 14:46 UT and 16:29 UT at two heights (20 000 km and 38 000 km). The downward arrows indicate the decrease in line emission from the corona to the prominence. Boxes 1, 5, 6, and 10 correspond to the corona, while the other ones are located on the prominence.
Current usage metrics show cumulative count of Article Views (full-text article views including HTML views, PDF and ePub downloads, according to the available data) and Abstracts Views on Vision4Press platform.
Data correspond to usage on the plateform after 2015. The current usage metrics is available 48-96 hours after online publication and is updated daily on week days.
Initial download of the metrics may take a while.