Free Access
Fig. 3
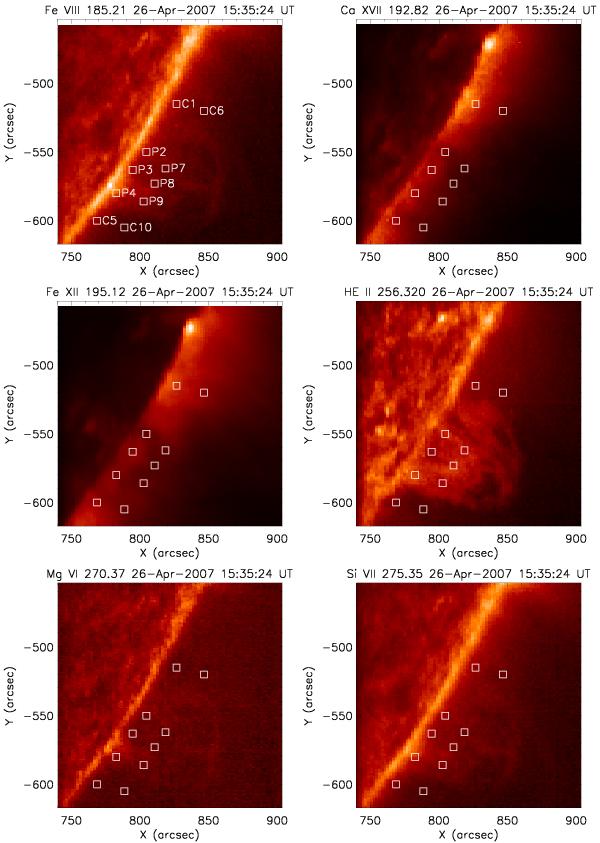
Raster images obtained with fil_rast_s2 on April 26, 2007 between 14:46 UT and 16:29 UT. The white boxes on each raster indicate the positions around the prominence where line profiles are averaged.
Current usage metrics show cumulative count of Article Views (full-text article views including HTML views, PDF and ePub downloads, according to the available data) and Abstracts Views on Vision4Press platform.
Data correspond to usage on the plateform after 2015. The current usage metrics is available 48-96 hours after online publication and is updated daily on week days.
Initial download of the metrics may take a while.